 minute to read

The blog was not reachable! For a total of roughly sixteen minutes, BoniClaud was offline. Probably nobody noticed—or so I thought. It turns out that a Google crawler was scheduled to visit my site during the outage. Google notified me that the next crawl is now delayed by three days, which impacts the site’s performance. New content won’t be indexed, and the website’s “activity” score won’t reflect any updates over the weekend.
I am already almost done with my second big project. That also includes the relevant monitoring software to fully retrace the system status during the outage. So you’ll have to wait a little until you can read up were the outage reports come from.
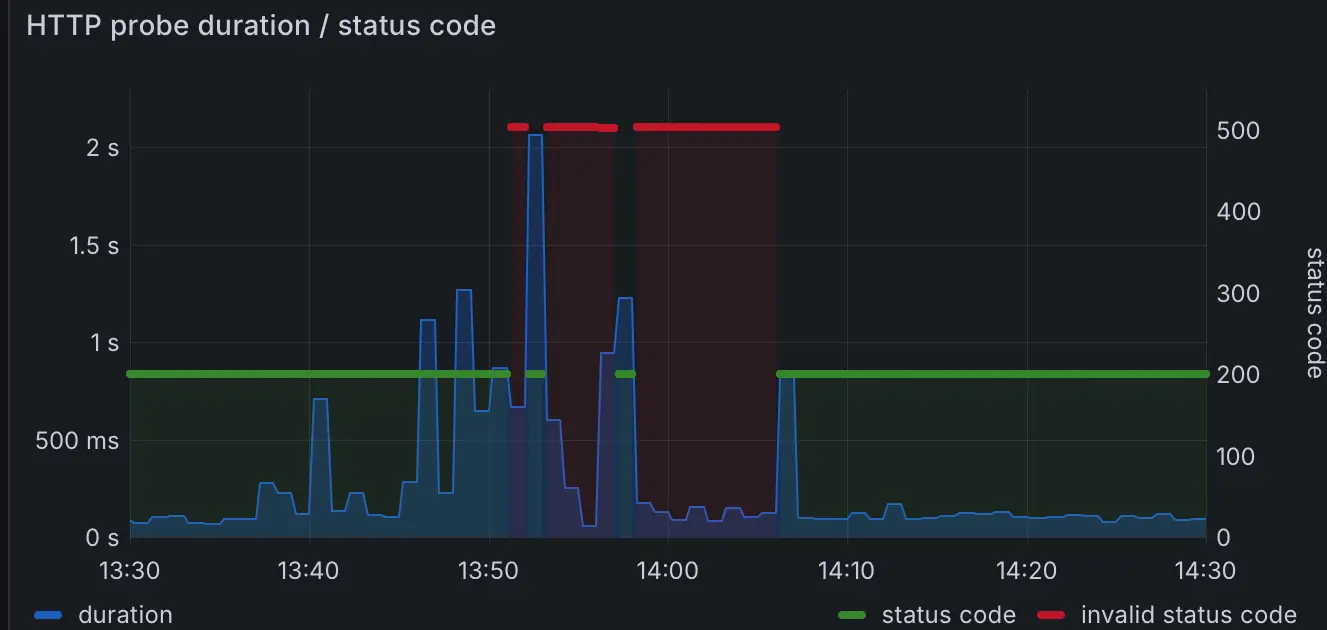
The HTTP probe report for BoniClaud clearly shows what happened. Normally, the HTTP probe returns in about 100ms (since the probe runs within the same network). However, at 13:45, the probe time started to climb, peaking at one second. At 13:51, BoniClaud became entirely unreachable.
The site briefly came back online, but a stable connection wasn’t achieved until 14:07—resulting in a total downtime of 16 minutes.
Since the blog has been online for over a month, the availability is currently 99.96%. While this is acceptable for now, given there are no further failures, the issue still needs addressing as I aim for higher availability. My probe only checks once a minute, meaning the true downtime could be closer to 18 minutes (99.95%). For my goal of achieving 99.99% uptime, every second counts. Though “four nines” uptime is mostly critical for business applications, it’s a fun milestone to aim for—even for a personal blog.
Here’s my theory—though I’m not eager to test it, as doing so might cause another outage.
At 13:35, I committed an update to the blog software. I merged the changes into the master branch, triggering a rebuild of the Docker image. The main change? Updating the underlying PHP image to the latest version. This caused the Gitea actions to download the new image into the local cache.
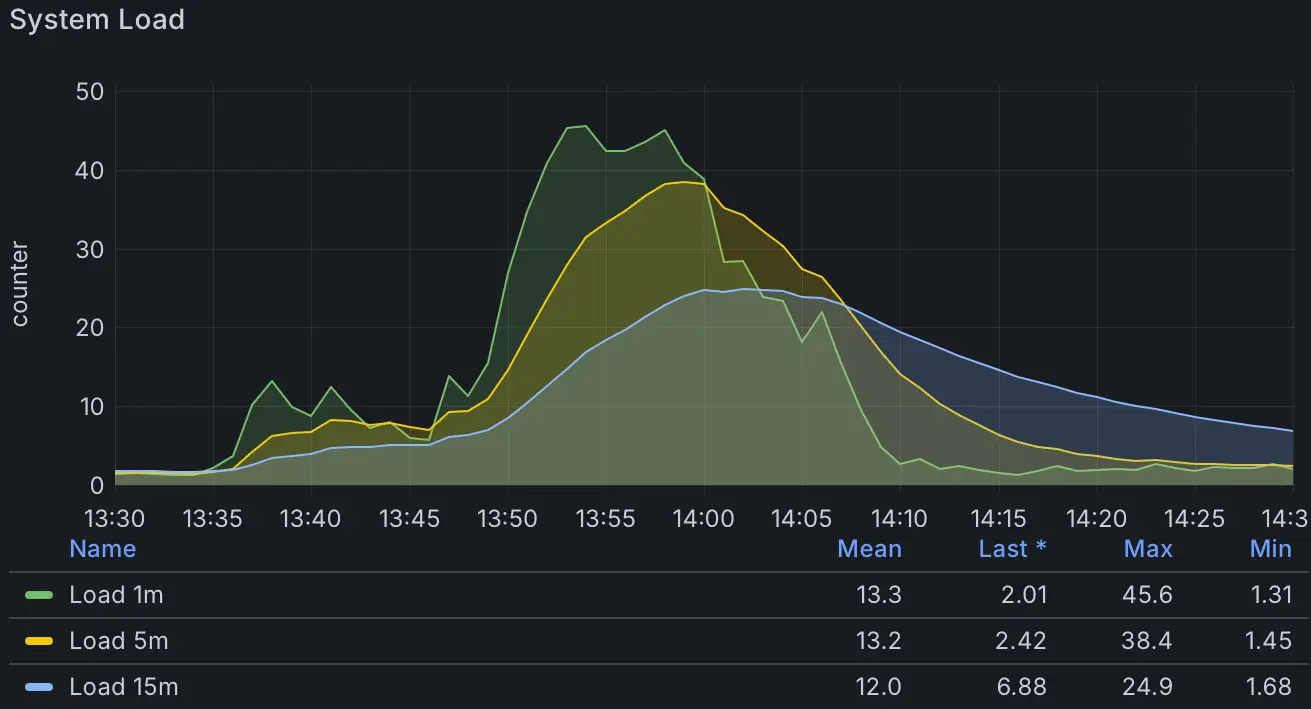
The load averages for the cluster tell the story. At the time of the outage, the load spiked dramatically, peaking at 45.6 for one-minute averages. To put this in perspective: on a Raspberry Pi with four CPU cores, this means an average of 45.6 processes were waiting for CPU time. The system was massively overloaded, leading to significant delays for processes.
While the Gitea action consumed significant resources, it wasn’t the sole issue. ArgoCD, which constantly monitors the BoniClaud deployment’s health, detected increased HTTP probe delays and flagged the pods as unhealthy. ArgoCD began scheduling new pods to replace the unhealthy ones. However, spinning up new pods required even more resources, further increasing the load. The new pods failed to reach a healthy state in time, compounding the issue.
To address the problem, I made two key changes:
ArgoCD’s monitoring thresholds were adjusted to give BoniClaud more leeway before marking pods as unhealthy. Previously, HTTP probes allowed a one-second delay before triggering an alert. I increased this to two seconds to accommodate occasional delays without overloading the system with new pod deployments.
The probe frequency remains at every 10 seconds, allowing three consecutive failures before action is taken. With the new timeout of two seconds, ArgoCD will only mark a pod unhealthy after 30 seconds. Including the time needed to spin up replacement pods, the system should now take roughly one minute to self-heal.
Previously, BoniClaud ran on a single pod. In normal rolling updates, this is fine—ArgoCD replaces one pod at a time, ensuring there’s always at least one healthy pod running. However, when the single pod is marked unhealthy, it’s immediately queued for termination, leaving no backup.
By increasing the default pod count to two, even if both pods are marked unhealthy, only one will be queued for deletion at a time. This ensures there’s always at least one partially functional pod during recovery. While this doesn’t reduce system load, it provides resilience when pods are struggling but still capable of serving requests.
Additionally, Kubernetes clusters are designed for dynamic scaling, so deploying multiple pods per service aligns with best practices.
A definitive fix would be adding more computational power to the cluster—or actually turning the Raspberry Pi into part of a multi-node cluster. Currently, if the RPi goes down for any reason, the blog goes down with it. Expanding the cluster would allow other nodes to handle traffic when one node is struggling.
This is particularly relevant for tasks like software updates, which can temporarily increase load. Preventing future panics requires planning for these scenarios.
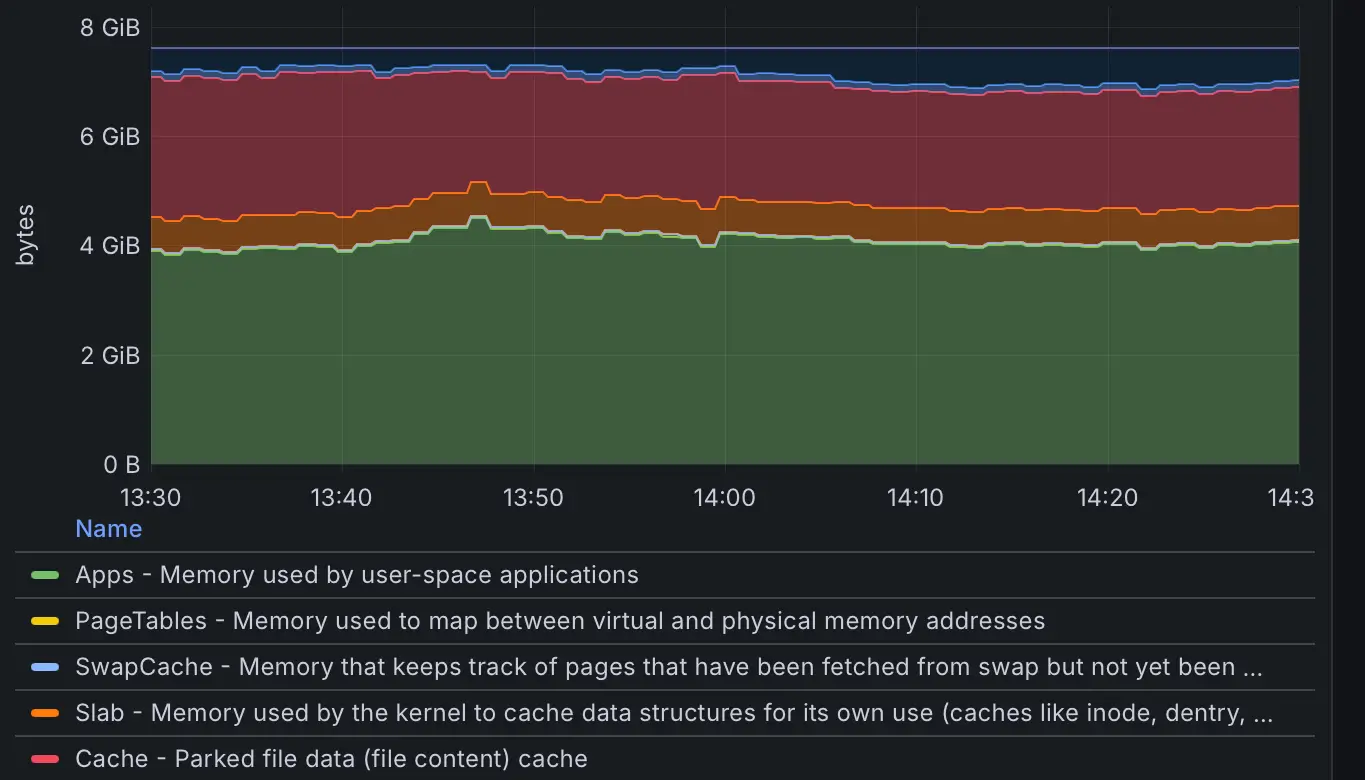
The second key metric, memory usage, tells a different story. While almost 90% of available memory is used, it remained stable. The Raspberry Pi has 8GB of RAM, of which roughly 4GB is actively used by services. The additional 4GB is reserved, with around 1GB allocated to cached data. While freeing cached memory is possible, it would slow processes dependent on frequently accessed data.
Networking, meanwhile, posed no issues. The Raspberry Pi is connected via a gigabit switch, and Cloudflare caches almost all content, minimizing internet traffic.
An outage is definitely a reason to panic—at least briefly—when your blog unexpectedly goes offline. However, this experience showed me that I need to trust the system more.
Ultimately, I didn’t manually intervene to fix the issue. The outage lasted as long as the Gitea action took to complete (28 minutes and 7 seconds), after which ArgoCD healed the BoniClaud deployment automatically.
I’m still maintaining 99.96% availability, but another outage would jeopardize that score. The fixes I’ve applied should improve stability moving forward, but I’ll also need to revisit why a simple Docker build takes nearly half an hour. As the cluster expands and gains more power, I’m optimistic that BoniClaud will become even more robust.