 minute to read

Before I started setting up the new node, I had to answer a key question: What does the new node need? How much power makes sense for my cluster’s scope, and what hardware should I pick? While many of these questions are shaped by the cluster’s existing setup, some required a bit more digging. And let’s be honest: if you’ve got a cluster, you’re going to want those great dashboards to monitor every little aspect—because why not?
To be honest, I was surprised at how easy it was to get monitoring up and running. Prometheus deployed smoothly via ArgoCD, and because all services were already logging for Prometheus, data collection just worked out of the box. To visualize these logs, I set up Grafana, which was also straightforward—except for one caveat: the default Grafana Helm chart disables persistence. That wasn’t a huge deal (since Prometheus stores the data), but I lost my default dashboards. Grafana can be deployed with preinstalled dashboards, which is probably the best approach. Alternatively, you can mount a small persistent volume so Grafana can store and load dashboards from there.
But for now, Grafana only displays the cluster’s status. To expand on that, I added the Prometheus Blackbox Exporter, which can query internal or external web services. I configured it to monitor the BoniClaud blog twice: once via the public Cloudflare address and once via a local cluster-internal address. That way, I can see both the blog’s internal performance and Cloudflare’s performance. Spoiler alert: Cloudflare is noticeably more reliable than my blog.
With monitoring up and running, I could finally see the cluster’s real statistics. Since there’s only one node, the overall cluster stats mirror the node’s stats exactly.
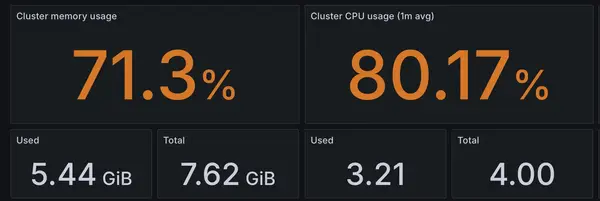
The numbers aren’t great, but I expected that. The Raspberry Pi’s memory usage hovers around 71%, and CPU usage is at 80%—at idle. Interestingly, RAM isn’t the main issue; I still have about 2GB free, and that doesn’t change much under load.
However, that 80% CPU utilization is concerning. If any service starts a CPU-intensive task, the remaining 20% buffer disappears fast, causing the system to become not just slow but downright unresponsive. High CPU usage also means more heat: my RPi runs at 80°C already and will thermal throttle at 85°C, leaving very little headroom.
Armed with this data, I asked myself: What does a new node really need? First, it must be ARM-based to match my existing node. Running a cluster on mixed architectures can be done, but it’s more complicated than I want to deal with.
Monitoring showed that memory is a bigger concern than CPU (though more CPU power is never a bad thing). There is a Raspberry Pi 5 with 16GB of RAM, but it’s significantly more expensive than a standard Pi. I also considered mini PCs with modern CPUs, but most use Intel chips, which doesn’t fit my ARM requirement. After some research, I stuck with the Raspberry Pi ecosystem—I’m familiar with it, and the RPi 4 has served me well so far.
The RPi 5 does have a PCIe slot, allowing for expansions. Many folks add an SSD for improved storage performance, but I don’t need that right now. (Spoiler: I did make a storage-related oversight, but that’s a story for another day.) A free PCIe slot could be useful for future projects, like adding an AI accelerator or even a small graphics card—less for power, more for the novelty of integrating a GPU into the cluster.
I wish I’d set up monitoring back in Project Yggdrasil, because it was so painless. Now I’ve spent countless hours pouring over graphs and load statistics, and it’s renewed my excitement for this homelab project. I find myself optimizing every last percentage point just to see a minor dip in some chart.
In the end, I’m sticking with my trusty Raspberry Pis. There may be more powerful mini PCs out there for a Kubernetes cluster, but I’m fond of the Pi platform. And with the new node on the horizon, I’m eager to see how it handles the cluster’s load—and what new possibilities it opens up.